
I can help you build your data science presence, discuss the importance of analytics to your business, teach methods to your data science team, and more.
Current Speaking engagements
MWSUG, Pittsburg, PA, September 13-14, 2021
MWSUG, Preconference Training, September 10, 2021
Past Speaking Engagements
SAS Global Forum, Virtual, May 2021
Ohio SAS Conference – Virtual Webinar – August 26, 2020
IowaSUG, DeMoines, IA May 18, 2020 – canceled COVID
NEBSUG, Omaha, NE May 19, 2020 – canceled COVID
SAS Global Forum, Washington, DC March 29-April 1, 2002 – canceled COVID
MWSUG, Chicago, October 2019
SCSUG, Baton Rouge, October 2019
Ohio SAS One Day Conference, 2017, 2018, 2019 (Sponsor)
SAS Boot Camp, The University of Akron, Jan. 2020 to Feb. 2020.
Some of my Papers
Dr. Steven Myers is an evangelist for economists in data science and the 2020 SAS Distinguished Educator. An applied econometrician, he has taught SAS® programming and advanced analytics to students for four decades. He is responsible for the Joint Certificate in Economic Data Analytics awarded at The University of Akron in partnership with SAS since 2015. His students are highly placed in data science careers locally and nationally. He was the first CIO of UA splitting time between production computing and overseeing exciting developments in academic computing including tech-enhanced classrooms, distance learning and faculty support. He retired from the University of Akron after a 41-year career teaching econometrics and is thrilled that one of his former students now has the faculty role of building future econometricians.
He is the organizer of the first Data Science Day at UA in 2017 with plans for a second in 2020. He received BS/MA in economics from WVU and MA/PHD in economics from The Ohio State University. He has presented at MWSUG and SCSUG and been active in Ohio SUG conferences. He writes at LinkedIn and at EconDataScience.com, where economics puts the science into data science.
Announcement of the SAS Distinguished Award
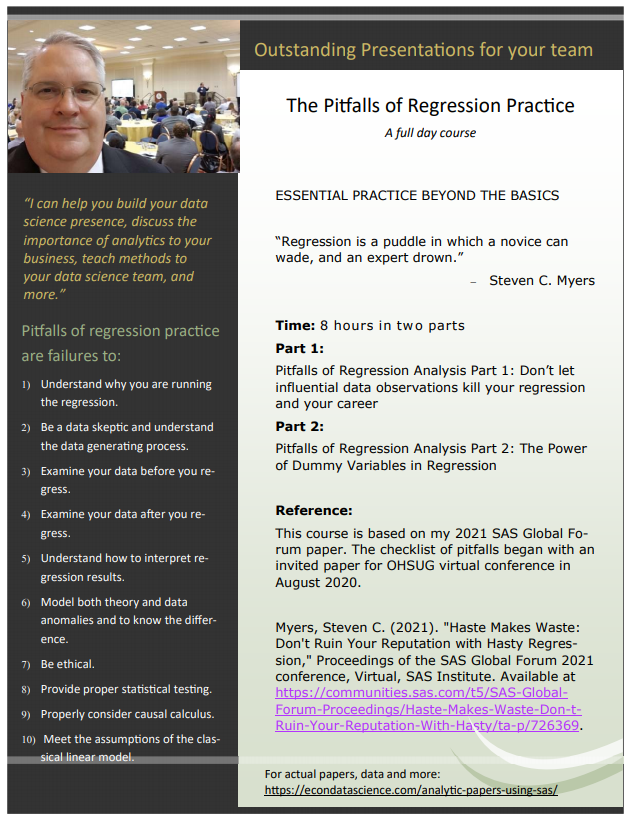
Part 1: Don’t let influential data observations kill your regression and your career.
Recommended time commitment:
4 hours, morning, before Part II
Course may be customized to your needs.
One page advertisement:
The Pitfalls of Regression Analysis
Course Overview:
If your regression models could use a tune-up and you’d like to get better insights from your data, this class is for you! How do you know if your data is lying to you? The answer lies in following ethically applied econometric rules and being aware of and avoiding pitfalls in regression practice. The essential skills in this training are not typically taught in a single-semester econometric or regression course.
Regression analysis is like a puddle in which a novice can wade, and an expert drown.
We are going to explore the depths. For example, do you know that two regressions models can both be highly significant and produce very different conclusions? You will learn processes, a checklist of pitfalls, to help you know which model is correct and which is lying to you.
This class is for statisticians and programmers who already have a basic understanding of regression models and some experience writing SAS programs to manipulate and analyze data.” It will be appreciated by experienced analysts and statisticians alike.
This course is based on the 10 Regression Pitfalls, developed by the author. It also leans on an ethical approach to applied analysis. You will learn what you must do to be an ethical data analyst and how to avoid regression pitfalls.
Part 1 Content:
Part 1 will cover the first regression pitfalls by way of examples with data and code that you will be able to access. A focus will be on what you can learn with residual analysis.
Ever rush to a regression model because it seems the right approach and is a quick way of documenting a relationship from which you will make business decisions based on the explanations (estimates) or the prediction? This paper will discuss and show how you could confirm your expectations with strong statistical indicators and still be extremely wrong (confirmation bias). Did you do any exploratory investigation before you ran the regression and perhaps more importantly did you do any exploration of the data after you ran the regression? Graphics can be used in simple regression especially when the data is ordered, but for multiple regression we need to statistically analyze the residuals. We will discuss the role of data cleaning and model specification in the case of contaminated data, non-normal errors, and influential observations. OLS parametric regression, robust parametric estimation and local nonparametric regression will be discussed.
Part I: Course Outline:
In part 1 your will learn:
- Regression Analysis has pitfalls and doing applied work requires an ethical code (Pitfall 7)
- The classical assumptions get a bad rap (Pitfall 10)
- “Why?” (Pitfalls 1 and 9)
- Asking the right question is tough and believing the answer is foolish.
- Articulation and Specification are as critical as Data Cleaning.
- Hasty Regression will ruin your career or at least it should.
- To be a data skeptic before you regress (Pitfall 2 and 3)
- How Exploratory Data Analysis can lead you astray.
- Why knowing the Data Generating Process is critical
- About extreme values, missing confounders, missing observations
- Correlations aren’t causation and always lead to confirmation bias.
- To be a data skeptic after you regress (Pitfall 4)
- “Residuals are the measurement of our ignorance”
- Influence statistics to the rescue.
- That robust methods do work. (Pitfall 6)
Prerequisite Knowledge Recommendation:
Topics vary from simple to advance, but the students need only a working knowledge of basic regression estimation and enough experience or education in statistical testing.
Prerequisite SAS Knowledge Recommendation:
Basic knowledge of base SAS programming and PROC REG or other regression procedures. Experience with ODS graphics will be a plus.
Recommended time commitment:
4 hours, afternoon, after Part I
Course may be customized to your needs.
One page advertisement:
The Pitfalls of Regression Analysis
Course Overview:
If your regression models could use a tune-up and you’d like to get better insights from your data, this class is for you! How do you know if your data is lying to you? The answer lies in following ethically applied econometric rules and being aware of and avoiding pitfalls in regression practice. The essential skills in this training are not typically taught in a single-semester econometric or regression course.
Regression analysis is like a puddle in which a novice can wade, and an expert drown.
We are going to explore the depths. For example, do you know that two regressions models can both be highly significant and produce very different conclusions? You will learn processes, a checklist of pitfalls, to help you know which model is correct and which is lying to you.
This class is for statisticians and programmers who already have a basic understanding of regression models and some experience writing SAS programs to manipulate and analyze data.” It will be appreciated by experienced analysts and statisticians alike.
This course is based on the 10 Regression Pitfalls, developed by the author. It also leans on an ethical approach to applied analysis. You will learn what you must do to be an ethical data analyst and how to avoid regression pitfalls.
Part 2 Content:
Part 2 will cover the second half of the regression pitfalls by way of examples with data and code that you will be able to access. The focus of the second course will be working with and using dummy variables.
Few tools are as powerful as various regression procedures. Choosing to model with right hand side dummy variables can raise the power of the regression modeling many fold. Perhaps we desire to model the result of a treatment or highlight certain observations for unique influence, or find results across an entire class of observations. This paper will discuss the coding, specification, testing and interpretation of dummy variables as we represent binary classifications (yes/no, male/female) and multiple classifications (strongly agree, somewhat agree, neither agree nor disagree, somewhat disagree, strongly agree). Additionally, using dummy variables in log equations, for seasonality, fixed effects and structural change models will be discussed.
Part II: Course Outline:
In part 2 your will learn:
- Regression Analysis has pitfalls and
doing applied work requires an ethical code (Pitfall 7)– expansion of Part 1 - Why dummy variables are so smart.
- Problem articulation, specification, testing and interpretation (Pitfalls 1,5, 6 and 9)
- You can’t fix with analysis what you bungle in design. The power of thinking before you act.
- Stratification. Data are not all apples, some are oranges.
- How to code, name, use, and interpret dummy variables (Pitfalls 5, 6 and 9)
- Simple dummy variables aren’t that simple. (Pitfalls 5, 6, and 8)
- The mechanics of specification modeling (and why this is rarely taught)
- Marking observations, trend changes, interactions with other variables
- Statistical Testing and a lot you may not know.
- Advanced examples of dummy variable usefulness (Pitfall 10 and more)
Prerequisite Knowledge Recommendation:
Topics vary from simple to advance, but the students need only a working knowledge of basic regression estimation and enough experience or education in statistical testing.
Prerequisite SAS Knowledge Recommendation:
Basic knowledge of base SAS programming and PROC REG or other regression procedures. Experience with ODS graphics will be a plus.
SAS Global Forum, 2021, Virtual Presentation
Title:
Haste Makes Waste: Don’t Ruin Your Reputation with Hasty Regression
Regression analysis is like a puddle in which a novice can wade, and an expert drown.
Abstract
How do you know if your data is lying to you? The answer lies in following ethical, applied econometric rules and being aware of and avoiding pitfalls in regression practice. These essential skills are not typically taught in single-semester econometric (or regression) course. This presentation will discuss hasty regression and demonstrates why it represents a terrible testing strategy leading to unsubstantiated and false conclusions. A baseline regression includes a dummy variable for the treatment. The hypothesis is that the dummy variable when true (or on, or equal to 1) represents a statistically significant change in the outcome measure of the dependent variable. A simple data set is used to illustrate that the initial insignificant result is dead wrong. And in the end, it has an outsized and positive effect that is superior to alternative specifications. None of this would be known if the analyst stopped after the false signal of that first hasty regression. PROC REG and its TEST statement are used to perform nested Wald-type F-tests. Multiple specifications are shown to each be significant. SGPLOTS of results and residuals help to understand the process. The outcomes follow a quadratic path with no role for the treatment variable or there’s a clear structural break because of the treatment. To test one model against the other, non-nested hypothesis testing is used. Ramsey RESET misspecification tests in PROC AUTOREG and regression selection processes within PROC REG are employed.
Current Version (version 3) PDF
SAS Data and Code (*.sas)
Full digital proceedings available at SAS Communities.
A full-day course based on the Pitfalls of Regression Analysis
Presented: MWSUG2019 October 1, 2019 Chicago
BEST PAPER in Business Leadership
Proceedings: https://www.mwsug.org/2019-proceedings.html
Direct link: https://www.mwsug.org/proceedings/2019/BL/MWSUG-2019-BL-104.pdf
Presented: 2019 SCSUG Educational Forum, October 19, 2019, LSU, Baton Rouge
Proceedings: TBD
Github repository: https://github.com/campnmug/rent
Abstract
Economists, business leaders and analysts spend a great deal of time analyzing structured cross sectional data. This paper is an introduction to exploratory data analysis for economic and business data analytic students in an introductory course in economics to teach data handling and SAS programming and features SAS® PROCS MEANS, UNIVARIATE, SGPLOT, FREQ, TABULATE, CORR, TTEST and REG. A data set on rents paid is used to illustrate the solution of the problem: do female students pay higher rents than male students?
It is essential to learn all you can about your data before rushing to analysis, yet analysts typically rush to more advanced and fancier techniques by ignoring or giving only cursory concern to the underlying data. In this paper we show how to ground the analysis in a firm understanding of the data generating process and suggest many ways to learn about the under lying data.
Presented: MWSUG2019 October 1, 2019 Chicago
Proceedings: https://www.mwsug.org/2019-proceedings.html
Direct link: https://www.mwsug.org/proceedings/2019/BL/MWSUG-2019-BL-101.pdf
Github repository: https://github.com/campnmug/time
Business leaders as well as data analysts and data scientists need to have an understanding of the particularities of time series data. This paper reports on an introduction to time series as taught to students in a first business analytics course making use of data from FRED, the marvelous time series repository at the St. Louis Federal Bank. Students are cautioned not to run to advance techniques before stopping to fully explore the data and this approach is designed to instill a EDA mentality into the students while teaching them how to manipulate and characterize time series data in SAS® and thereby set the ground work for more advanced work in time-series econometrics, forecasting and predictive analytics. Also, instilled in the students is an appreciation of knowing the data generating process. SAS programming is taught through this approach focusing on SAS functions such as DIF and LAG, PROCS CORR, MEANS, TABULATE and SGPLOT. The paper concludes with a basic coverage of random walk and spurious correlation that can easily result in mistakes when one does not first investigate data stationarity.
Hands on Workshop: 2019 SCSUG Educational Forum, October 19, 2019, LSU, Baton Rouge
Proceedings: TBD
Github repository: https://github.com/campnmug/Model_selection_and_inference
Abstract
A qualitative indicator such as a binary variable, D, may describe a population difference, such as ‘male’ and ‘female,’ or ‘before’ and ‘after’ some event. This workshop will walk you through the regression analysis of whether an outcome variable, Y, is influenced by a qualitative binary event, D. Using only 14 years of data on Y, you will learn that what seems very simple actually takes 8 different regressions and many Wald statistical tests to reveal that the best conclusion is a complexity of model specification and statistical inference. The take away is no matter how sophisticated the technique and how good the data, there is no substitute for thinking your way through a problem. Blindly following technique alone is a bad practice that leads you to make huge mistakes.
You will learn the value of articulating a problem, preparing data, exploring the data and the importance of the data generating process. You will experience interpreting the results and inferring the validity of the results and drawing a conclusion. You will learn a rather comprehensive set of techniques in a very simple example. Most importantly, you will learn that the roadmap for similar problem solutions is not guided by the techniques as much as the critical application of human thought.
Presentation: 2020 SAS Global Forum, April 29-May 1, 2020, Washington, DC (cancelled – COVID)
Paper: https://support.sas.com/resources/papers/proceedings20/4705-2020.pdf
Paper Proposal:
Economists make great data scientists. Economics offers as a discipline many valuable skills such as problem solving ability and storytelling. When economic theory and deep business acumen combine with applied econometric analytics plus an obsession to understand the data generating process and methods of dealing with dirty data you have a lot of research savvy. Add a layer of deep SAS® programming and analytics and you have the beginnings of a great data scientist.
We partnered in 2015 with the SAS Global Academic Program to offer a joint certificate in economic data analytics. Every graduate and undergraduate since have received the certificate. This paper will discuss the methodologies taught and pedagogies used in our program. Students learn programming in a team- and problem-based learning environment working on real data and real problems.
A revision of the undergraduate program in 2003 made a major commitment to bring the success of MA students to undergraduates with much success. Starting in Fall 2019, we accept students into an even more powerful curriculum leading to a BBA in Business Data Analytics, requiring analytic courses in economics and business.
The paper will discuss the state of the saturated field of analytics in higher education and how University of Akron is adapting to remain competitive and to produce highly demanded students. The talk will highlight student success stories and provide a guide to others how to prepare students for data science careers.
Paper accepted for SESUG 2019, Williansburg, VA, but later withdrawn.
Ever rush to a regression model because it seems the right approach and is a quick way of documenting a relationship from which you will make business decisions based on the explanations (estimates) or the prediction? This paper will discuss and show how you could confirm your expectations with strong statistical indicators and still be extremely wrong. Did you do any exploratory investigation before you ran the regression and perhaps more importantly did you do any exploration of the data after you ran the regression? EDA before may be enlightening, but EDA after is critical. Graphics can be used in simple regression especially when the data is ordered, but for multiple regression we need to statistically analyze the residuals. We will discuss the role of data cleaning and model specification in the case of contaminated data, non-normal errors, and influential observations. OLS parametric regression, robust parametric estimation and local non-parametric regression will be discussed.
Few tools are as powerful as various regression procedures. Choosing to model with right hand side dummy variables can raise the power of the regression modeling many fold. Perhaps we desire to model the result of a treatment or highlight certain observations for unique influence, or find results across an entire class of observations. This paper will discuss the coding, specification, testing and interpretation of dummy variables as we represent binary classifications (yes/no, male/female) and multiple classifications (strongly agree, somewhat agree, neither agree nor disagree, somewhat disagree, strongly agree). Additionally, using dummy variables in log equations, for seasonality, fixed effects and structural change models will be discussed.
A brief on this is in my blog post: Ethics rules in applied econometrics and data science
This paper is in outline form and the draft focuses on the importance of causality in analysis. Econometricians are obsessed with causality and it is one of the reasons that economists put the Science in Data Science.