Myers on Educating Economics Students, SAS Global Forum Proceedings

I am an Award Winner, educating economics students with SASI am a presenter, educating economics students with SAS

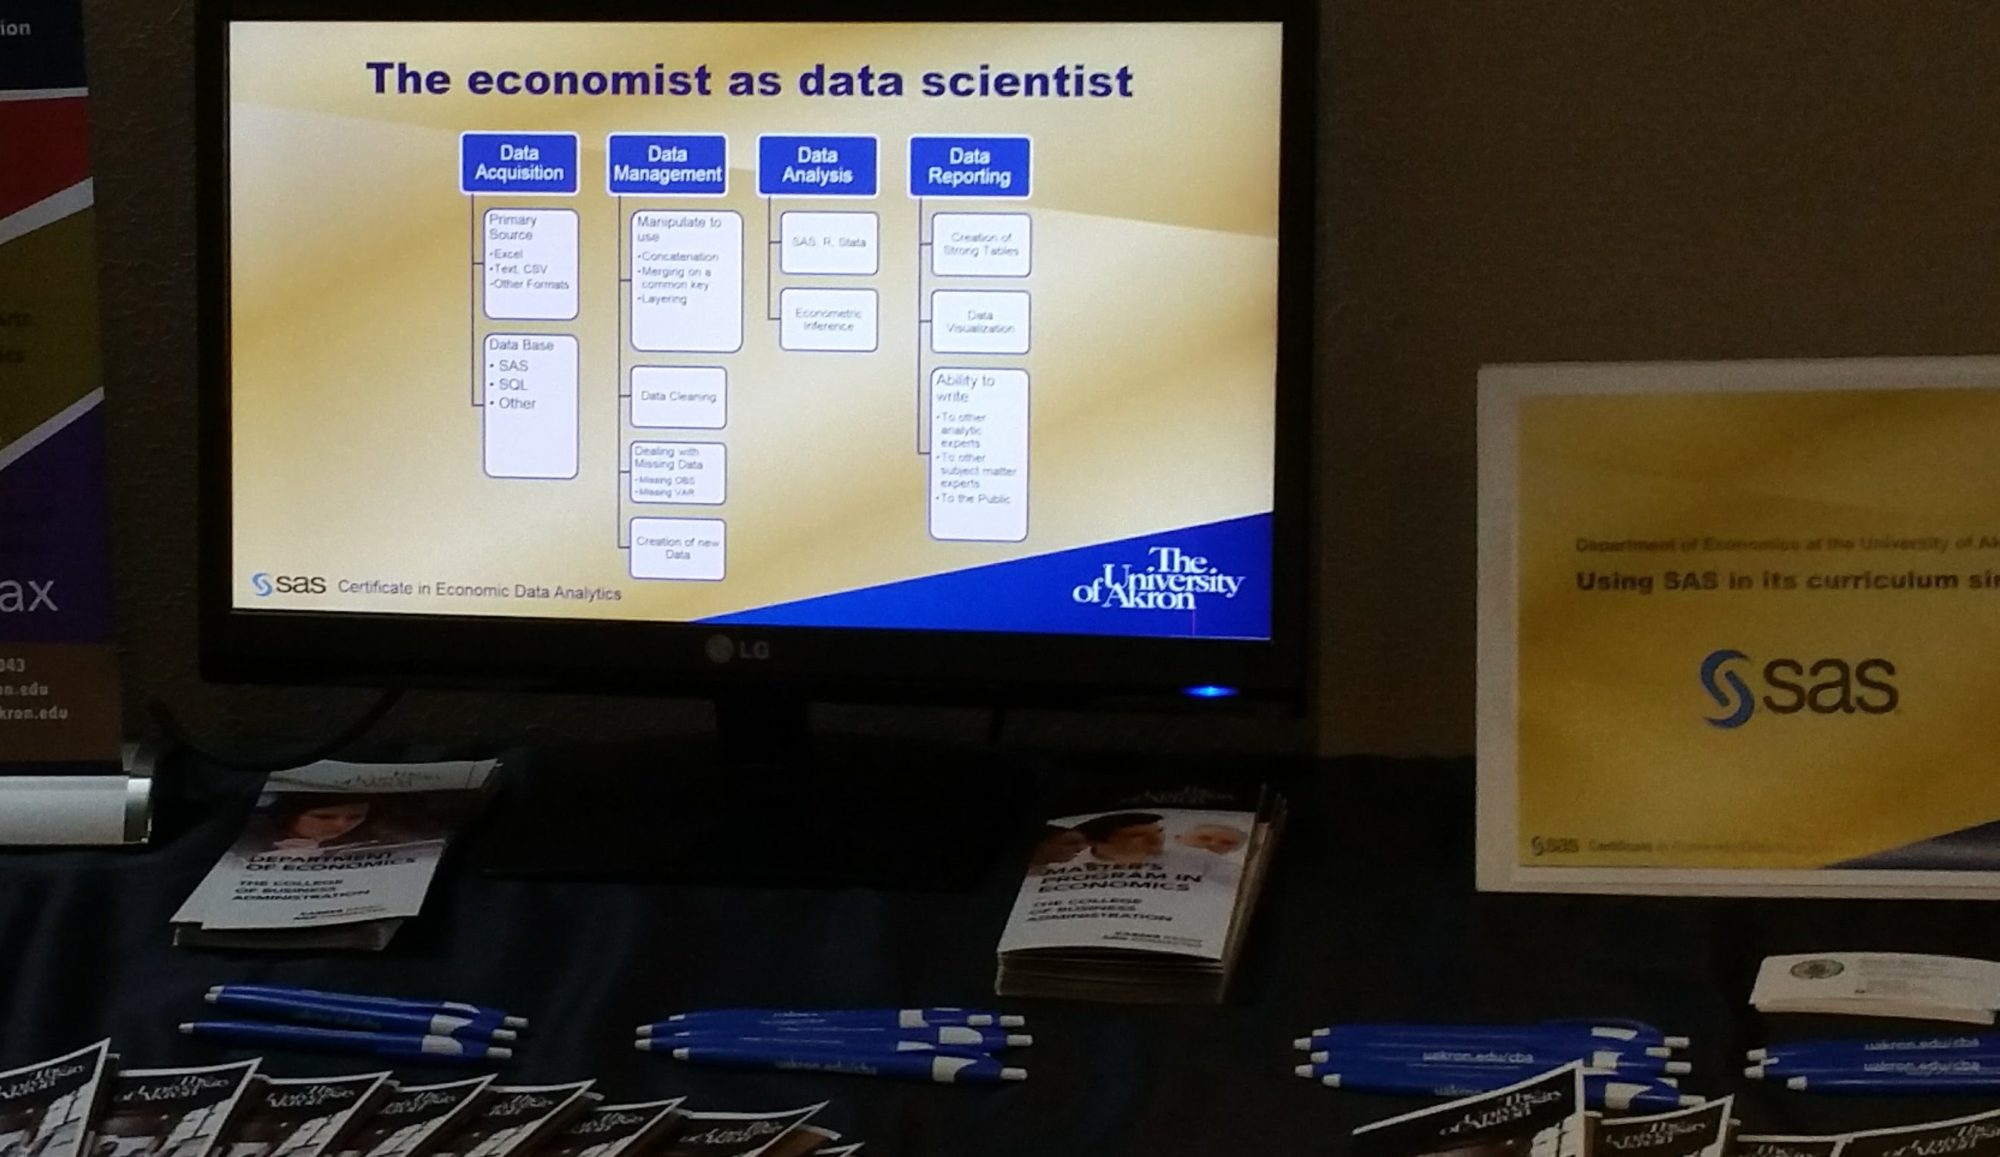
This year the SAS Global Forum canceled for good reasons. I was looking forward to walking amongst the cherry blossoms with my wife Kimberly. I remain excited about the opportunity to speak to SAS Educators about educating economics students and to highlight our SAS partnership at the University of Akron, College of Business Administration, Department of Economics. Thanks go to Josh Horstman for his invitation on behalf of the Global Forum Content Advisory Team.  I missed meeting up with all of the great people of the SAS Global Academic Programs including Lynn Letukas, director, and Rochelle Fisher, our program manager for the University of Akron. 

I had hoped to expand friendships with colleagues met and those to be met and those who I have met only online.  And, perhaps most of all, I am disappointed that I missed being presented with the 2020 SAS Distinguished Educator award. 

Honored and humbled

I am still honored and humbled by the 2020 SAS Distinguished Educator award and recall the congratulatory call from Lynn with the same original shock and pleasure. Also, I am honored to be invited to speak at the SAS Global Forum. Thanks to all involved, especially the conference chair, Lisa Mendez, who worked so hard to coordinate this gigantic global event. I was pleased to meet her at SCSUG and hear so much of the news about the upcoming event.

My Published Paper

Nevertheless, I want to announce that my paper is now published in the 2020 SAS Global Forum Proceedings. My paper titled Show Me the Money! (thanks to Josh for that part) Preparing Economics Students for Data Science Careers is embedded below and a link to download is on the floating menu bar. The paper is a combination of my journey over my four-decade career and description of our programs and SAS use in the Department of Economics and why economists make great data scientists.

If you take time to read it I would appreciate any feedback you have. We can discuss curriculum or whatever, and I hope to leave this as I retire from UA as a roadmap for faculty that follow.

Click to access 4705-2020.pdf

Enjoy and please contact me to discuss.

Other posts on educating economics students with SAS

Please check out other SAS education-related blog posts. A few examples of educating economics students:

SAS Boot Camp
SAS Coding, Problem Based Learning and preparing economists for data science careers: frustration to elation
SAS Certificate in Economic Data Analytics
Economic Freedom: Solve Problems, Tell Stories
Importance of Economic Analysis to Data Science
COVID-19 in the State of Ohio, updated daily

Updated 4/11/2020:  Everyone is interested in how we are doing in Ohio during the COVID19 pandemic. Accordingly, I look at the data from the Ohio Department of Health and assemble it into a report for you. You can read my full report below which includes multiple graphs and tables and can download the pdf. I intend to update the pdf report each day as new data becomes available.  Also, you should check back often as the information displayed will change with new data. I will also offer new items as I think of them. 

Full disclaimer, I am not an expert in epidemiology nor have I attempted to model the behavior and predict the future. On LinkedIn,  I have written about the importance of having a qualified subject matter expert paired with each data modeler. I am nonetheless interested in any suggestions you have. I have added a footnote to each table explaining that the definition of a case changed on April 10 from “confirmed (by a test) cases” to the “confirmed cases plus probable cases” which inflates the data by 47 cases on April 10. This to match definitions by the CDC, but worries me as to the lack of consistency before and after the change date.

First up is Weekly changes in the number of cases, hospitalizations, and deaths. A look at the number of cases shows a considerable decline in the cases. Every data point is an average of the last week of cases. When changes are on way down it suggests that the curve of the total caseload is indeed being bent.

weekly changes in cases of covid-19

Rates of hospitalizations and deaths are shown in the next graph. This past week Amy Acton said Ohio has tested 50,000 people and our cases are just under 6000, so that means in rough measure that of everyone tested, the large majority of are showing symptoms or clearly in harm’s way, that the positive results are that about 12 percent. That suggests the actual death rate which is 3.9% or all positive cases, maybe as low as (12%) of 3.9% or about 0.4% of all those tested and much less than the death rate out of the population of 11 million. Of course, I do not have individual testing data and this is a bit of hopeful speculation.

rates of cases


I also did a visualization of the hospitalization and death rates by age and sex and posted that to LinkedIn. You can access that here. Similar numbers and heatmaps are in the full report below.

I used SAS® to organize and analyze the data.

Because people are interested in how we are doing in Ohio during the COVID19 pandemic I hope this is of interest to you.

OH_report_COVID19

Download the report here.

Proper citation requested. Steven C. Myers. 2020. Ohio Covid19 report. accessed at https:econdatascience.com/COVID19 on (your access date).

Request for Comments to myers@uakron.edu