Bad economists are everywhere, and it is so easy to be good.

First published on Facebook on November 7, 2017

When I first started studying economics in the early 1970s, one fact quickly stood out. Everyone was an ‘economist.’ That is, everyone seemed to have opinions on all parts of the economy, every law, and every turn of events. I would then and since get disheartened reading stories from those who purport to expound on economics when in reality, they repeat only the commentary made in the press or by politicians whose comments are meant to divide and not inform. Most had part of ‘it’ right, but few seemed to get the big picture. Or if they declared the big picture, they were woefully short of evidence.

As one example, let me assure you that no economist ever introduced the “Trickle Down Economic Theory.” It is a political unicorn; it doesn’t exist and never has. Its roots are with the partisan. It is not a scientific theory. Those who use it show their ignorance or bias. There is so much of this going around (as they say).

Economics is very easy to understand at the level of principle. I love teaching it and watching the ah-ha moments happen as another principle finds its way from the text to the applied. Economics is a broad and deep study, and it takes time to incorporate all of the principles into a cogent and consistent body of knowledge. It is a scientific discipline, the queen of the social sciences, and the most analytical of business knowledge.

What disheartens me the most is the bad economists out there (using Frederic Bastiat’s simple definition of what is a good economist and what is a bad economist. A “bad economist” is one who cannot “see the unseen,” that is, they are not wise or knowledgeable enough to analyze a problem. This bad economist is simply ignorant. On the other hand are the economists who are “bad” and who are not ignorant but willfully misleading because they are driven by ideology or, most often, their paycheck is signed by someone who wants a particular point of view. Years ago, I referred to these as “agency economists.”

Between a good and a bad economist this constitutes the whole difference — the one takes account of the visible effect; the other takes account both of the effects which are seen, and also of those which it is necessary to foresee. Now this difference is enormous, for it almost always happens that when the immediate consequence is favourable, the ultimate consequences are fatal, and the converse. Hence it follows that the bad economist pursues a small present good, which will be followed by a great evil to come, while the true economist pursues a great good to come, — at the risk of a small present evil.

Frédéric Bastiat. That Which is Seen, and That Which is Not Seen, http://bastiat.org/en/twisatwins.html

Why would people buy into what the agency economists are selling? Perhaps the message resonates with a fear or a preconceived notion that is confirmed. So you believe what you hear, and before long, the “bad economist” experts have you believing that inequality in wages is always bad, tax cuts for the rich are always bad, capitalism itself has failed, and so many other pieces of nonsense.

Source: https://www.scienceabc.com/social-science/what-is-the-broken-window-fallacy.html

I don’t care how you vote, but I do care about the principles on which you make your decision. If you understand the principles of economics and want to vote opposite of me, then, by all means, do so with no ill will from me. If, on the other hand, you vote based solely on what “bad economists,” biased journalists, and biased politicians (a redundant saying) have said to you, each with their own persuasive point of view, and you do so without seeking to understand how what they tell you has to do with well established economic principles then I am saddened beyond belief.

N.B. My Undergraduate economics adviser referred to economics as a layering process, each course adds a new layer, and each has a greater chance of sticking. He liked pointing out this story. Dean Rusk, Secretary of State in the 1960s, was asked why he was hiring Ph.D. economists (good ones, history shows) into positions that did not require an economist. He replied that by the time an economist gets a Ph.D., they have been trained and vested in marginal analysis (a scientific manner of problem-solving), and every problem of state was a study of marginal changes and their impact. In other words, Dean Rusk would not have hired anyone who believed in trickle-down theory, nor a bad economist.
Data Scientist Jobs Are Increasing For Economists: Evidence from the AEA

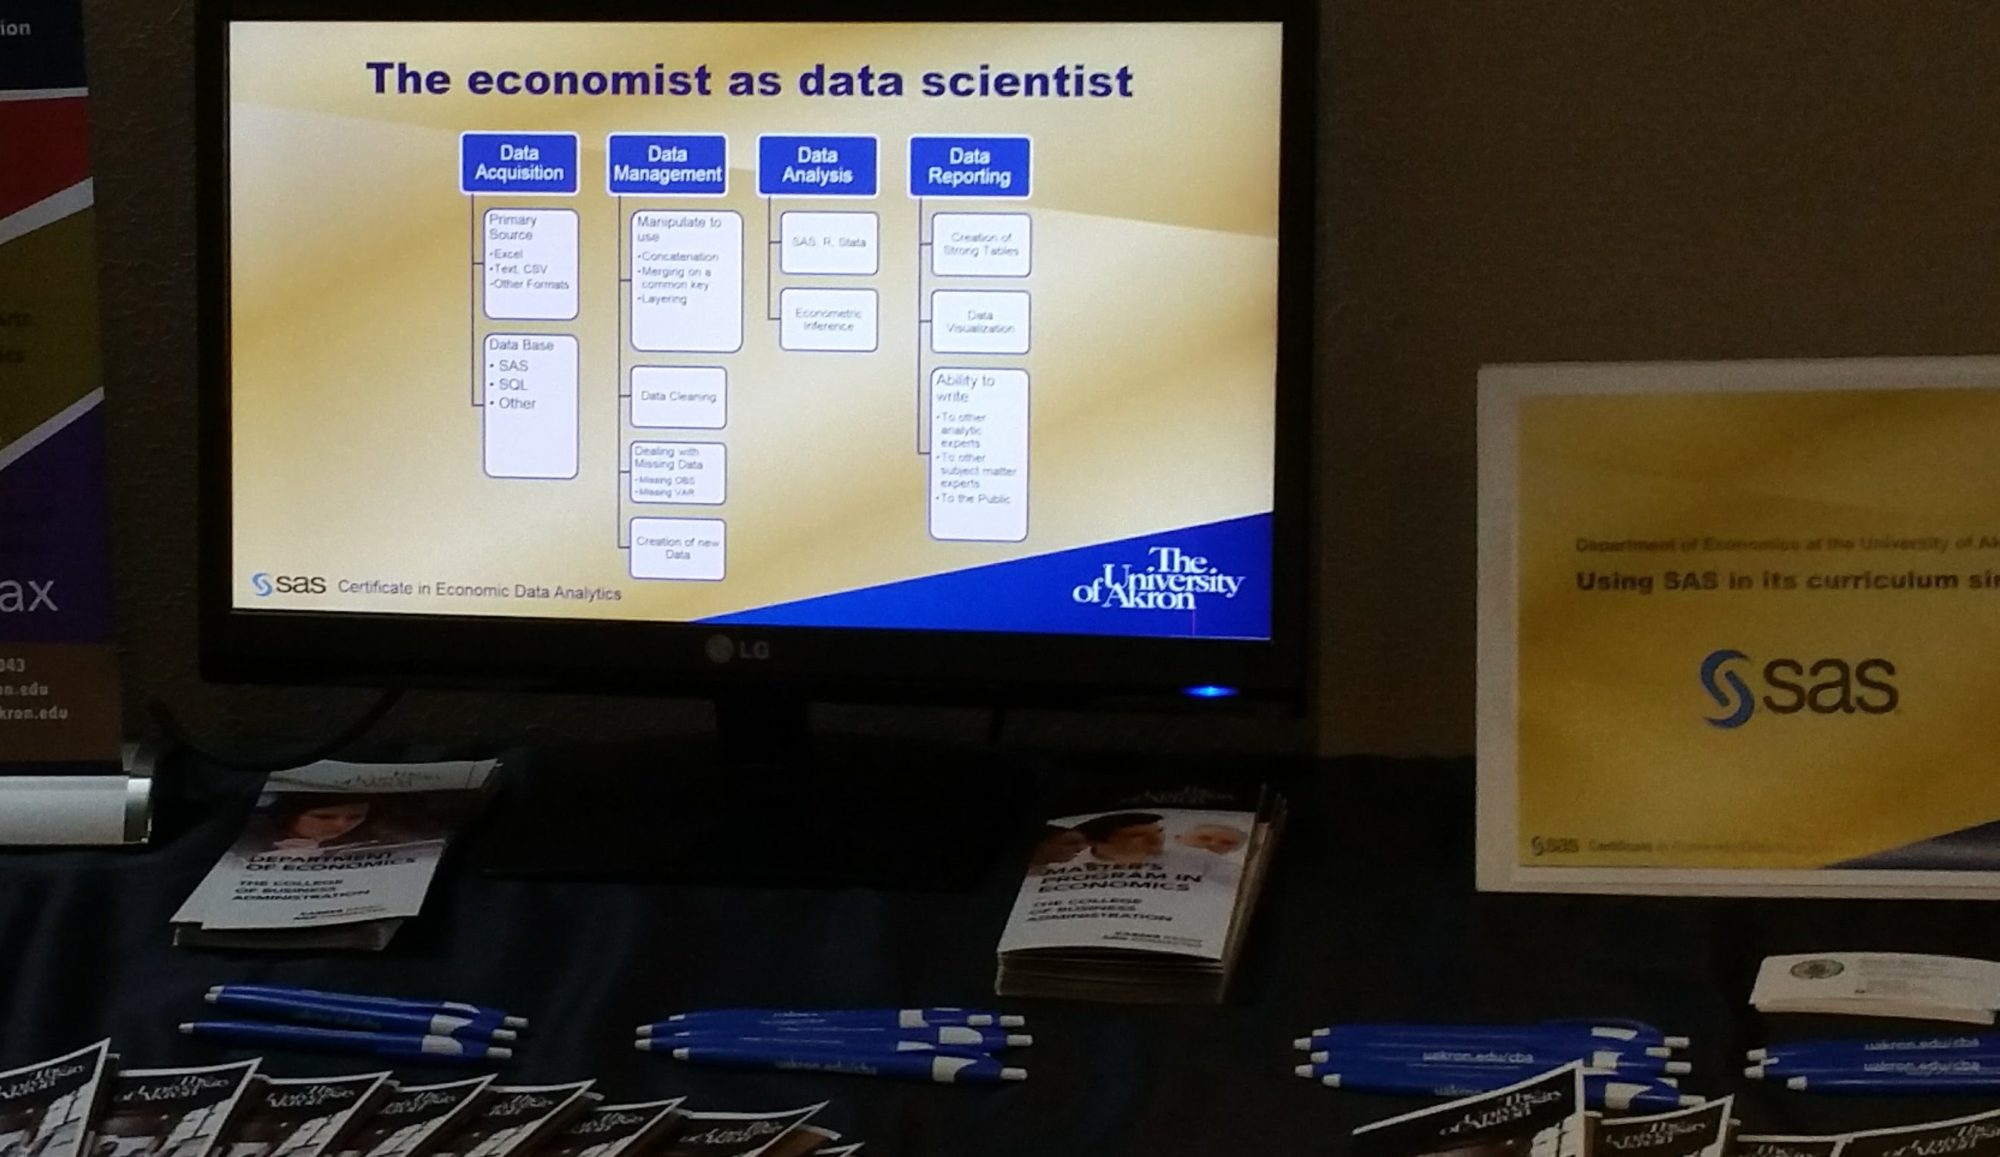
Economists, especially Econometricians, are in hot demand in the field of Data Science. Last March I posted Amazon’s Secret Weapon:  Economic Data Sciences which was one of many similar articles on the high demand. It is the entire premise of this blog and my work at university is to highlight this and point economists and our business data analytic students in that direction. Our curriculum is centered on SAS because having the students learning to program at a base level and to learn the power of SAS is a good basis for future job employment (see Data Analytic Jobs in Ohio – May/June 2019).

Because we are looking for a couple of PhD economists for tenure track positions, I thought to wander around in JOE (Job Openings for Economists) and eventually wandered into wondering how many Data Science jobs were directly advertising in the JOE competing with academic positions (including ours). 

So to sharpen my SAS SGPLOT skills i collected some data and found that indeed Data Scientists are in increasing demand over time in JOE , bur not as much as exists in the general market of Indeed.com.  Clearly in JOE job listings in the August to December timeline are the best time to find a data science job, and August 2019 should grow as more jobs are added leading up to the ASSA meetings in San Diego in January. If you’re there look me up, but I suspect I will be in an interviewing room from dawn to dusk. 

Enjoy! Comments welcomed. 


Updated to final 2019-2020 numbers
Preliminary 2019-2020 numbers
What do you think about the SGPLOT?
5/5

For those wanting to see the SAS code

My apologies, Elementor does not handle txt code so well, or I have not yet figured that out. (Small amount of research shows the lack of a code widgit  is a problem with Elementor.)

Code with data and image are available at https://github.com/campnmug/SGPLOT_Jobs

data ds;
input date MMDDYY10. total DStitle NotDStitle;
t=_n_;
Datalines;
2/1/2014 0 0 0
8/1/2014 2 2 0
2/1/2015 0 0 0
8/1/2015 5 2 3
2/1/2016 1 1 0
8/1/2016 11 5 6
2/1/2017 1 1 0
8/1/2017 12 6 6
2/1/2018 2 1 1
8/1/2018 14 11 3
2/1/2019 7 4 3
8/1/2019 12 6 6
;
run;
Title1 bold 'Data Scientist Jobs Are Increasing For Economists: Evidence from the AEA';
Title2 color=CX666666 'Advertisement for Data Scientists in Job Openings for Economists (JOE)';
title3 color=CX666666 "Counts shown are the result of a search of all listings for 'Data Scientist'";
proc sgplot;
vbar date / response = total discreteoffset=-.0 datalabel DATALABELATTRS=(Family=Arial Size=10 Weight=Bold)
legendlabel="Total Data Scientist Jobs" dataskin=gloss;
vbar date / response = DStitle transparency=.25 discreteoffset=+.0 datalabel DATALABELATTRS=(Family=Arial Size=10 Weight=Bold)
legendlabel="Job title is 'Data Scientist' " dataskin=gloss;
yaxis display = none ;
xaxis display = ( nolabel);
inset "To put this in perspective:" " "
"Most 'Data Scientist' and 'Economist' jobs"
"are not advertised in JOE"
"A search for 'Economist' and 'Data Scientist'"
"on Indeed.com yields 514 jobs on Oct 14, 2019"
/ position=topleft border
TEXTATTRS=(Color=maroon Family=Arial Size=8
Style=Italic Weight=Bold);
inset "Aug 2019" "preliminary"
/ position=topright noborder
TEXTATTRS=(Color=black Family=Arial Size=8
Style=Italic );

format date worddate12.;
footnote1 Justify=left 'JOE listings are at https://www.aeaweb.org/joe/listings';
footnote2 Justify=left 'Only active listings in either the Aug-Jan or Feb-Jul timeline were searched.';
footnote3 Justify=left 'Search conducted on Oct 14, 2019, so the last count will grow as new jobs are entered into the system.';
footnote4 ' ';
footnote5 Justify=left bold Italic color = CX666666 'Created by Steven C. Myers at EconDataScience.com' ;
run;
run cancel

Poverty Progress

Between 1980 and today the world is getting better, humans are making amazing progress. 

GDP per-capita in the US rose from $28,590 to $54,542, almost doubling as measured in 2010 dollars.

Worldwide, extreme poverty fell by over half as measured by the world bank.  (42 percent of the world’s population was in extreme poverty in 1981, but by 2015 only 9.9% of the world was in that state).

The number of wage salary workers that are paid at or below the federal minimum wage in the US fell from 15% to 2%.

The US Official Rate of Poverty rose by 0.5 percentage points.

Wait. What?

The world is improving even if you don’t think so.

Ask your friends about the drop in extreme poverty. I bet most get it wrong. My evidence is from the Misconception Study conducted by Gapminder Foundation. In fact, take their test to see how many misconceptions you have about the world. (It is right on the front page at https://www.gapminder.org/). Out of 12 questions administered to thousands across the world, the average score for every group is less than if the answer had been chosen by random. 

Once misconception is the world is getting worse, when indeed it is really getting much much better. But stories of better do not lead the news, only stories of woe. Further if you got your education in the 70s and 80s as I did you may have many misconceptions simply because you believe data learned correctly then has not changed. 

Why has the official poverty rate not fallen with all this world wide progress?

If world extreme poverty is down, why is the US official poverty rate so flat, nearly the same now as almost 50 years ago? The first problem is world wide poverty is bench marked on an absolute income standard. The OPR in the US is a relative income standard. They measure very different things. 

The second problem is income is the wrong measure for poverty. Using bad measures of important concepts like poverty creates a misconception that the problem is much worse and virtually unsolvable and attracts policy prescriptions to do exactly the wrong thing. 

The World Bank expects Extreme Poverty to essentially vanish by 2030. The US government has made no such forecast by any year in the future. 


What is the better measure of US poverty?

Meyer and Sullivan track what it costs to consume at a level not to be in poverty, that is, to create a consumption poverty rate (CPR) that is shown on the last track. The better question is not do the US poor have enough income, but do they have enough consumption? Without getting into what poverty programs are good and bad, the case of food stamps, now SNAP, is such instructive. Take two families with identical income and one of them received one or more consumption based forms of assistance such as SNAP and clearly one is relatively better off. The OPR does no consider any assistance to the people in poverty that they measure. 

But a goal to eradicate poverty needs to be based against an absolute standard with policy clearly targeting families to get them across that standard. We do not want people deprived. It is not about income, its about existence beyond deprivation. 

One of the reasons for the consumption poverty rate (CPR)  is consumption is a better predictor of deprivation than income. (Perhaps two people have the same income, but one cannot afford to put good food on the table, who is worse off?).

You can find their excellent paper here (https://leo.nd.edu/assets/249750/meyer_sullivan_cpr_2016_1_.pdf)

To listen to the news media and the advocacy groups everything is a crisis and a disaster and the world and the US is getting worse. The nice thing about data is it proves the obverse, the world and the US is getting better at a rate begun in about 1980 that is astonishing. But good news does not bleed and therefore will not lead.

So here is what is remarkable: From 1980 to 2015 the consumption poverty rate fell by 9.4 percentage points, while the official poverty rate rose by 0.5 percentage points.

So what make more sense, that the US has a poverty rate of 13.5 (in 2015) that is virtually impossible to lessen or eliminate, or a Poverty rate based on consumption that is 3.5% of the population that we might be able to further reduce.  

I would like to see the end of poverty wouldn’t you? 

Be a Data Skeptic and do your own research

We hear constantly about bias reporting and fake news and you should be motivated to be skeptical about any data you hear reported and motivated to search out the actual facts.

In other cases, such as the FBI’s hate crime data, the data are not reliable without understanding how it is collected. The data is fine, but year to year comparisons are not easily possible because of the data design. (see The importance of data skepticism. Hate crimes did not rise 17% in one year. )

Many data websites do exist to help you find actual facts. 

Some of the best fact based sites are
https://Justfacts.org
https://Gapminder.org
https://Fred.org
https://humanprogress.org.

So the message is be humble, don’t believe everything at face value and learn how and do your own research.

Super Bowl – What you do not see

What happens when benefits are concentrated and costs are dispersed? What happens when the benefits are concentrated and the costs are unseen? Frederic Bastiat understood this in July 1850 and called out bad economics that has followed governmental subsidies every since. Good economists according to Baitiat see what is seen and unseen, that is they consider opportunity costs that others ignore.

John Stossel at Reason.com, always entertaining, explains it well.

https://www.facebook.com/Reason.Magazine/videos/832233770456814/

Bastiat taught us, a lesson we regularly forget:

“In the department of economy, an act, a habit, an institution, a law, gives birth not only to an effect, but to a series of effects. Of these effects, the first only is immediate; it manifests itself simultaneously with its cause — it is seen. The others unfold in succession — they are not seen: it is well for us, if they are foreseen. Between a good and a bad economist this constitutes the whole difference — the one takes account of the visible effect; the other takes account both of the effects which are seen, and also of those which it is necessary to foresee. Now this difference is enormous, for it almost always happens that when the immediate consequence is favourable, the ultimate consequences are fatal, and the converse. Hence it follows that the bad economist pursues a small present good, which will be followed by a great evil to come, while the true economist pursues a great good to come, — at the risk of a small present evil.”

From: That Which is Seen, and That Which is Not Seen, Frédéric Bastiat accessed at http://bastiat.org/en/twisatwins.html, paragraph 1.

The Super Bowl city, Atlanta, replaced the Georgia Dome with the beautiful new Mercedes-Benz Stadium, opened in 2017 for $1.6 billion with taxpayers on the hook for $1.02 billion over the course of the deal. (source). Is there an expected positive return. Economists say no. The unseen costs illustrated nicely in the Stossel video below are just that, but true and real costs none the less. The application of proper accounting of opportunity costs is frequently overlooked and because they do not show on an invoice or bill, are never fully accounted.

Brooking economists, Roger Noll and Andrew Zimblist, edited “Sports, Jobs, and Taxes: The Economic Impact of Sports Teams and Stadiums,” in 1997 which concluded a million dollars in federal tax dollars were lost in each of 10 facilities built in the 1970s and 1980s. States and localities give up even more hoping that the returns to having the sports franchise in their area is so much more. Their conclusion on the oft cited this will create jobs reason is not positive.

Their conclusions: 

“In every case, the conclusions are the same. A new sports facility has an extremely small (perhaps even negative) effect on overall economic activity and employment. No recent facility appears to have earned anything approaching a reasonable return on investment. No recent facility has been self-financing in terms of its impact on net tax revenues. Regardless of whether the unit of analysis is a local neighborhood, a city, or an entire metropolitan area, the economic benefits of sports facilities are de minimus.”

Roger Noll and Andrew Zimblist writing at brookings.edu.

They find similar disappointing results on all other reasons offered to subsidize a stadium as negative.

Dennis Coats, a University of Maryland economist, writes a follow up to his 1999 study with Brad R. Humphreys and concludes

“The results here are generally similar to those of Coats and Humphreys; the array of sports variables, including presence of franchises, arrival and departure of clubs in a metropolitan area, and stadium and arena construction, is statistically significant. However, individual coefficients frequently indicate harmful effects of sports on per capita income, wage and salary disbursements, and wages per job.”

Dennis Coates. “Growth Effects of Sports Franchises, Stadiums, and Arenas: 15 Years Later.” Mercatus Working Paper, Mercatus Center at George Mason University, Arlington, VA, September 2015. Cited at https://www.mercatus.org/publication/growth-effects-sports-franchises-stadiums-and-arenas-15-years-later.

What about civic pride? 

That feeling of having something great in your city from having the Super Bowl in your area. Doesn’t that make it all worthwhile? Peter A. Groothuis and Kurt W. Rotthoff in “The Economic Impact and Civic Pride Effects of Sports Teams and Mega‐Events: Do The Public and the Professionals Agree?” in Economic Affairs report

Most of the economic literature finds sports teams or mega‐events have little or no economic impact, but there are mixed findings on the magnitude of civic pride. Overall, most of the economic literature suggests that the benefits created by sports teams or events do not outweigh the cost of public subsidies provided. We conduct a survey of public opinion on US residents’ perceptions of economic impacts and civic pride benefits from mega‐events such as the Super Bowl and the Winter Olympics. Our study asks the question: Do residents believe that mega‐events and sports teams generate positive economic impacts and civic pride or not? We find that, like economists, the public doubts that public funding of mega‐events is a good idea.

So enjoy the game and try not to think of the many negative effects of public expenditures so poorly rewarded. Frankly, I recommend you read more Frederic Bastiat and buy a coffee cup and kickback to enjoy a warm beverage to take away the chill of poor governmental expense.

Thomas Sowell and Economic Literacy

Image found at twitter.com/nick_bunker/status/971021895406641153, click image to buy.

I am teaching an introductory economics course that is below the typical principles level and is far too often taught as a “baby principles course” or such a watered down version of a principles course to be unrecognizable as economics. In my humble opinion, teaching a survey course as the watered down version of what we teach as Principles of Economics is a type of malpractice and an ethical lapse. It is the economic equivalent of teaching math by focusing only on adding and subtracting while obscuring all higher order functions as “beyond y’all,” or “too complicated.” It is also like teaching history as a set of unrelated dates without any context, or with only biased context. presented.

There are many books that report to survey economics available to me as a professor, but my choice is Thomas Sowell’s Basic Economics: A Common Sense Guide to the Economy, now in its 5th edition. The main reasons are:

  1. The proper goal for this course is to enhance economic literacy as a life skill, 
  2. Supply and demand drawing students once escaping the classroom forget all they learned, and worse remember that to solve that economic problem requires graphics and mathematics they can’t recall,
  3. Focusing on the graphics and equations necessarily competes with learning historical context and logical thinking,  
  4. Learning to not be deceived by good sounding things that do not hold up to scrutiny requires persons who are brought up to think critically, logically with historical context and the lessons of evidence, and finally
  5. the book is inexpensive (about $18 at Amazon) and close to Open Source in prices.

I desire to teach as Sowell writes, without any mathematics, equations or economic graphs and without being highly political. 

Students need to remember the principles of economics and not the ability to solve a problem with supply and demand graphs. They need to be economically literate. I think this course should be taught at this level with a foundation of common sense, logic and evidence. Moreover, in this highly partisan politicized world too often politics gets in the way of economics, or worse, someone hears an economic principle and immediately associates it with a partisan position. Students need also be introduced to an many economic fallacies as possible.

My mantra for students these many years since I have been teaching is we will embrace:

Economic Reality and not Wishful Thinking.

The freedom to this approach is that we can talk about policy and stay out of politics. My son relates a conversation when he was majoring in economics a few years ago with a highly partisan politically motivated student and head of a local campus political group. He was asked how my son could live with such an (insert pejorative political label here) for a dad. My personal politics beliefs were just the opposite. So I win. I leave politics outside of the classroom and focus only on analyzing the policies in a logical manner using historical context and evidence. 


Of course, I relate in class from time to time that the left think this and the right thinks that, but I am careful not to impress my political view on the students. I do not care if they figure it out, but I model the unbiased approach as much as I can. In fact i tell them if they vote left or right I do not care. Indeed, if they apply the evidence, logic and historical context to the problem then I am confident they are an informed voter and can pull whatever lever they wish. That is not my call, my mission is to make them think before they “jump.”

Remembering Gary Becker

Rarely have I read the first few paragraphs of an article and felt that it captures the essence of the words to follow as well as I just have in Heckman, et al., Gary Becker Remembered. Perhaps this impact is because of the subject matter and my interest forged in the 1970s. Gary Becker made study of economics at The Ohio State University so exciting for me and my student colleagues such as Randy King, Tim Carr and Patricia Shields.  

It was a period where the 2nd edition of Human Capital had just come out, when we had read mimeograph copies of his Woytinsky lecture and struggled with his Theory of the Allocation of Time. Generally, his work and thought permeating all we did and studied. He made so much sense and conveyed so much wisdom.  It was a time we were working for the National Longitudinal Surveys under Herb Parnes, taking micro and labor from him, Belton Fleisher, Don Parsons and Ed Ray. All who made my interest in labor and labor econometrics all the more deep. Additionally, George Rhodes and Jerry Thursby pushed me econometrically and I had all that wonderful access to the early waves of the original NLS cohorts. It was a great time, although I did not necessarily think so at the time being a typical graduate student with little time to consider words like “great time.” It was at least exciting and rewarding, and over the next 40 years fulfilling.  


We who were running massive number of wage equations had him ever in our thoughts. We built on his foundation while stretching the model this way and that, but always on his foundation. While I have long ceased running wage regressions, my students in econometrics regularly do as they practice the techniques and at the root of their work is making sure they who are not all labor economic oriented, understand that the foundation on which they learn and build is Beckers, making them read the now basic work that was so vivid in the 70s. Whether they apply techniques from Ronald Oaxaca or Jim Heckman or others, it is Becker with whom they must first contend. He was an “intellectual giant” always the scientist, depending on the evidence from the causal link of theory to data and analysis and on to testable conclusion. Come to think of it, few others can boast of such a tight link between the economic model and the econometric model and testable results over and over that confirms his brilliance.

Here is the first three paragraphs of that remembrance from:
 

 James HeckmanEdward LazearKevin Murphy.  Gary Becker Remembered, Journal of Political Economy. October 2018Vol. 126Issue S1Pages S1-S6 Accessed at https://www.journals.uchicago.edu/doi/full/10.1086/698751 on Jan 1, 2019.

“Gary Becker was an intellectual giant. No one had a greater impact on broadening economics and making its impact felt throughout the social sciences than Becker. Indeed, Milton Friedman once described Gary Becker as the most important social scientist of the second half of the twentieth century.

“For those of us who knew him, he was the most creative thinker we ever encountered. It was his astounding imagination that made many of his early critics think of him as a heretic. They were correct: he was a heretic much like Luther, Copernicus, and Galileo, who transformed their worlds, just as he transformed economics. He brought a rigorous and insightful approach to issues that were viewed as inherently noneconomic. Eventually, he won over the economics profession, detractors and all, who eventually became converts.

“Becker was a scientist in the true sense of the word. He believed that economics was useful only if it explained and helped to improve the world. He practiced what he preached and carefully analyzed all of the social problems he addressed. He was innovative yet rigorous, open to new thought yet disciplined in sticking to the established rules of analysis. Most importantly, he extended the boundaries of economics to much of social science.” 

Read the rest at https://www.journals.uchicago.edu/doi/full/10.1086/698751

Blog Launch

Launching EconDataScience

Forty years ago I was sitting in a hotel room in New York City being interviewed for a tenured position at The University of Akron. At my on-campus interview I was given the challenge of rebuilding the graduate curriculum of Statistics and Econometrics. Revised in my image, they included an emphasis on Applied Econometrics, hands-on computing with real data sets and code level programming in SAS. 

Economists have always in my lifetime been sophisticated economic data analysts and I have taken note as the term and title of data science and data scientist has arisen that economists cover a vast amount of the territory of what is data science and in a way always have. 

One year ago, I organized for our Department and College, the first Data Science Day held at The University of Akron featuring two of our MA alumni that held the title of data scientist. A survey of our graduates found that all of our graduates alumni and about half of  our undergraduates were in data analytic positions and many in data scientist or data science positions. 

That economists make  good data scientists will be the subject of many posts of this blog.  I will also comment on issues of economic literacy which I regard as a crisis in our world.  I am less likely to comment on policy than on principles, the former being befuddled with all manner of things and the latter more inviolate, removed from opinion and evidenced based.