Susan Athey on the Impact of Machine Learning on Econometrics and Economics (part 1)

Economists make great data scientists. In part, this is because they all are trained in the four pillars of data science (1) data acquisition, (2) Data manipulation, cleaning and management, (3) analysis and (4) reporting and visualization. Good programs make sure that the economics students are trained in all four areas. Economists have subject matter expertise that is wrapped in a formalized way of thinking and problem solving ability. Quick answer, why are economists so valuable in business? – They know how to solve problems and tell stories from the evidence. 

As to the analysis part of these pillars, economists are typically wrapped in causality and explanation of X in the y = f(X,e) model. Economists in forecasting become more interested in predicting y with less or much less on the factors X. 

When I talk to many I hear data science being linked only with Machine Learning as if ML and data science are synonyms. This is far from the truth, with Data Science being very broad and ML a specific way and in some cases a dominate way of approaching a data problem. ML is making its way into economic curriculum. So what is the role of ML in economics now and into the future and more particularly the role between econometrics and ML?

No one in the economics profession knows more about the intersection of economics and machine learning than Susan Athey who just last month gave an address to the American Economic Association and the American Finance Association.  I am posting this address so you may understand the current state. 

In part 2 of this post I link to her two day course offered in January 2018 on ML and Econometrics with Guido Imbens. 

The AEA/AFA address, Jan 2019

This video was captured at the joint luncheon for the American Economics Association and the American Finance Association that occurred at the January 2019 Annual Meetings in Atlanta. 

Susan Athey who is The Economics of Technology Professor of the Graduate School of Business at Stanford University delivers the address and is introduced by Ben Bernanke, former FED chair, now at the Brookings Institution.

external link: https://www.aeaweb.org/webcasts/2019/aea-afa-joint-luncheon-impact-of-machine-learning

Economists as engineers: A new Chapter

(0:59:25) “The AI and econometric theory need work, but they are not the main constraint…. Instead the success is going to depend on understanding the context, understanding the setting….

“(The economist can be) motivated by social science research about where should I be spending my time, where should I be intervening? (Economists need) to use empirical work to help figure out what the best opportunities are.

Economists can help with defining measures of success.  We need to recognize that AI has billions of ways to optimize so we better be telling the algo the right thing. Those algos need to be constrained and informed by 

(1:01:22)  “Broadly, when economists return to their institutions that are building AI and data science initiatives that … the social scientists (she thinks)  are going to be more important than the  computer scientist in terms of what is the conceptual thing, what is the thing that makes something succeed or fail, that makes it screw up and have adverse consequences versus being really successful and impactful. We (economists) are going to need to join interdisciplinary teams and the evaluation will be embedded and not separable from the system. So that means we are going to have the opportunity to intervene in the world like we never have before. But it also comes great responsibility because we will be the people in the room who really can understand the good and the bad and make sure it happens in a safe way.””
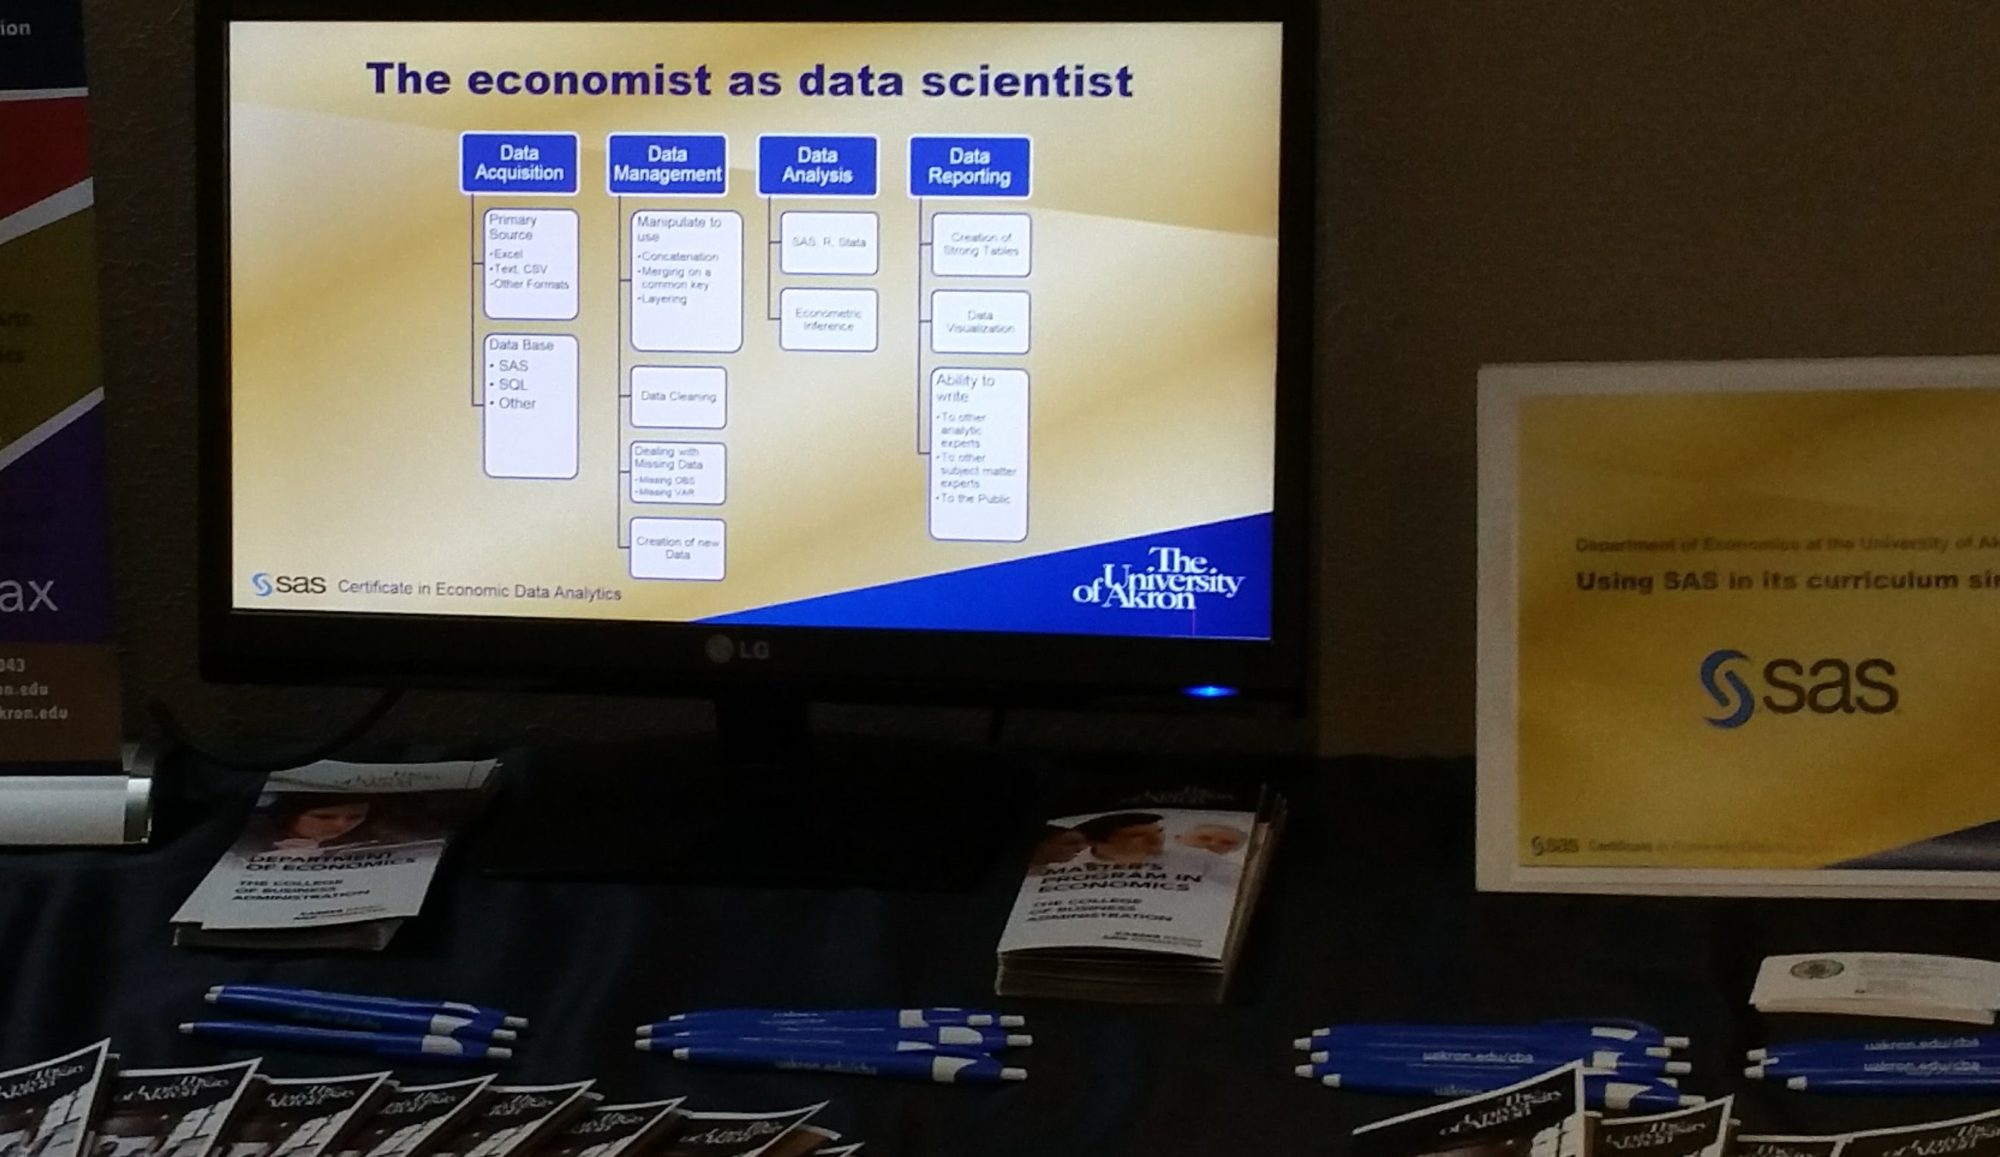
 

SAS Certificate in Economic Data Analytics

The Department of Economics is preparing economists with strong econometrics and programming skills  to prepare them to be data analysts and data scientists, ready to serve and lead business, governmental and not-profit institutions with their data analytic needs. Economists make the best data scientists, and in a team environment are a critical part of the data science team.  This owes to the rigorous analytical training that economists go through in programming, statistics, mathematics, econometrics and forecasting, but more importantly in their education in critical thinking and  problem solving in an environment that is both theoretical way and backed by scientific data evidence. In other words, economists stand out to employers. We have many testimonials that when economists are hired they move up in the organization quickly. The challenge is often getting employers to consider economists in the range of disciplines they hire.  One way we are using is to recognize our students for a particular skill, that of knowing SAS programming. 

The Economic Data Analytics Certificate of Completion is jointly sponsored by the SAS Institute and the Department of Economics  at The University of Akron. 

Spring 2018 SAS Certificate Presentation

The jointly offered certificate is based on student’s successful completion of the economics major core coursework in data analytics along with economic theory at either the undergraduate of graduate level.  Each honoree also successfully complete a major research study using SAS as the primary tool of their data analytic project. These data projects, most often the students senior research project, are a valuable asset to the student to help convince employer of their ability and interest in research. 

Importance of Economic Analysis to Data Science

Economists are unique in their approach to data analytics due to their unique training. They are story tellers, they are able to articulate problems and to take a rigorous approach to the solution of those problems. They understand the importance to understand the question: “why?”

Economists own causality and understand observational data, some are even said to be obsessed with the data generating process. Economists have a a strong linear regression toolkit and are well familiar with the processes that push beyond that level of rigor. Economists understand minimizing and maximizing of objective functions under constraint.

David Autor on Changing Patterns of Work

Are earnings differences between males and females due to discrimination? A typical approach is to compare the earnings of women to that of men and try to control for typical understandable differences such as education level and location and other factors. Perhaps education levels and location interact and an interaction term is introduced into our model. However, the largest assumption is that once we define our variables, homogeneity rules, that education is homogeneous, e.g., HS graduation means the same for all groups, over all times and locations). I see Autor’s lecture pointing out this heterogeneity and disputing the assumption that all persons are products of the same data generating process. He takes this on and at least for me smashes my initial biases. To be fair, this is my reading of his efforts, he does not utter the word heterogeneity at all, but I don’t think he needed to, not everyone in the audience are econometricians and the implicit heterogeneity problem is taken on directly. I will be sharing this lecture with my data analytic students as a great example of exploratory data analysis that allows a masterfully told story through complex preparation and easy to understand visuals.

The Richard T. Ely lecture at the 2019 American Economic Association meetings was presented by David H. Autor (MIT, NBER) comparing Work of the Past with the Work of the Future. Motivated in part by the “remarkable rise of wage inequality by education,” “vast increase in supply of educated workers,” and a “key observation (of the) polarization of work” that while “most occupational reallocation is upward,” “the occupational mobility is almost exclusively downward” for non-college workers, Autor proceeds to give rise to answers to the questions surrounding

  1. Diverging earnings and diverging job tasks
  2. The changing geography of work and wages
  3. The changing geography of workers, and
  4. What and where is the work of the future.

The visual presentation makes his data exploration very understandable and are masterfully done. He truly paints a picture that emerges from a vast amount of data that is entertaining and informative. This is well worth the 47 minutes and may actually challenge your preconceived thinking as to the nature of inequality in earnings. It is not as simple as one may think and he perfectly illustrates without ever uttering the word that data heterogeneity when ignored leads to false and inescapable conclusions.

Work of the past, work of the future. Richard T. Ely Lecture, AEA meetings, Atlanta, January 4, 2019.

Click on the above image and you will be well rewarded if you want to see a story told with strong graphics, proving to me anyway, that deep diving into data and presenting simple graphics (although complex in their creation) is a most effective way to communicate. A couple of examples of the graphics:

What if we do an econometric analysis of earnings between men and women using current data and a similar analysis from the 1980s. Can you see how this graph as one of many in Autor’s presentation might create havoc in comparing the result in the 1980s to one current? Watch the presentation, plenty of more visuals like this one.

SAS Coding, Problem Based Learning and preparing economists for data science careers: frustration to elation

Published on October 16, 2018 on LinkedIn

I love coding, but I love copying others code even more. There is a great SAS resource that is amazingly helpful, run by Lex Jansen (link below). I had a need and found it in a 2003 SUGI28 presentation: “Paper 118-28-Renaming All Variables in a SAS® Data Set Using the Information from PROC SQL’s Dictionary Tables,” by Prasad Ravi accessed at http://www2.sas.com/proceedings/sugi28/118-28.pdf

My need was to merge data from multiple years of the Index of Economic Freedom (https://www.heritage.org/index) across all countries where all variable names were the same. A simple merge overwrites the common variable name with the last data merged. So my creation of a clasroom problem/team based learning exercise by merging 2013 and 2018 data was much frustrated. Sure, I could go into the Excel and manually change every variable name in every sheet, but really that is what coding is supposed to before. The elegant macro by Prasad Ravi named “rename” worked and I modified it to change the specific prefix used (from NEWNAME_ to my choice) and to protect certain key variables (such as ID) for merging.

I changed %macro rename(lib,dsn); to %macro rename(lib,dsn,prefix,protect); and all is well. So the 2013 table will have prefix Y2013_ and I can protect the first 4 variables of country id, country name, webname and region which are (or should be) common in all years of the data. My specific change is limited to the inclusion of prefix and protect as illustrated in the PROC DATASET part of the rename macro shown here:

proc datasets library=&LIB; modify &DSN; rename %do i=&protect+1 %to &num_vars; &&var&i=&prefix&&var&i. %end;

and in the call %macro rename(lib,dsn,prefix,protect);

My economic data analytic students will be “thrilled” (or I will always think they should have been) as we move from EDA in Time Series to EDA in cross-section data. It is an introductory undergraduate class so nothing beyond simple presentations and simple statistics can be used and many do not yet have their statistics completed. After this class they will start down the multivariate inference, model selection and specification path. My class is to teach them SAS use in Economic Data Analytics and prepare for them a platform to stand on so any further foray into Economic Data Science is possible. At a minimum they will take required courses in econometrics and economic forecasting and encouraged to load up on other analytical electives.

Each problem they have to solve in their teams cover both the pillars of data science (aquisition, management and manipulation, analysis and reporting) and the pilars of applied econometrics (of problem articulation, data cleaning and model specification, hat tip to Peter Kennedy, p. 361 of his guide to econometrics, 6e.). The students just finished a time series problem/team based learning exercise requiring the merging of multiple datasets and a problem that requires extraoridinary articulation. The question was “Do deficits go up under republicians and down under democrats?” A moment of reflection beyond your personal knee-jerk reaction reveals that problem to have many facets and to the students discontent, there is no one simple answer. Dashed are their hopes that the first piece of analyitical effort will reveal truth and much dective work must ensue. The next step is into a problem/team based investigation of the role of economic freedom and progress throughout the countries of the world. I have until Monday to come up with the problem statement!

About Lex Jansen: If you do not know about the tremendous SAS resource at https://www.lexjansen.com then you should! I found a lot of help there after searching documentation and sas.support.com without finding the specific help I needed. Apologies to others offering similar approaches to a macro renaming, I do not know if the Ravi paper is the first or the best. What I know is it worked for me. Thanks to Prasad Ravi for writing it and to Lex Jansen for storing it. 

I mentionned applied econometrics and data science in the above and have to pause and thank two friends who I met each personally only once, but communicated with on these topics. Peter Kennedy has passed and I miss not asking him about my next brainstorm. He came and spoke to our university at my invitation in 2004. I was so thoroughly convinced of his applied econometric processes that his book (which I used from its first edition) and our conversations have effected my teaching to this day. While I had used problem based learning in my classes it was Peter who encouraged it as the single best way to teach applied econometrics. As much as the students in the midst of a PBL process “hate” it, the number of students feeding back their succcess in their careers and saying how it was the PBL that granted them success is my reward. Peter also writes in he book that there is a “world of difference between applied and theoretical econometrics …” that most university econometric “teaching is technique oriented rather than problem oriented.” He goes on to say that teaching applied and not theoretical econometrics is hard and brings the teacher no professional prestige. To this I can attest, but my product is not professional articles, but students in very high level data-analytic and sata-science positions.

As to data science it was work by Ken Stanford (@eKENomics), who I first talked to when he was at SAS, that convinced me that economists make great data scientists. Like Peter he confirmed much that I was already doing and teaching and helped me refine my approach to my teaching. He also was responsible for helping our students qualify for a SAS Certificate in Economic Data Analytics offered jointly by our department and SAS. In a pure self-serving manner I cite Ken’s contribution in a paper on our department’s website here. Ken serves on our Economics Advisory Board and has moved from SAS to Dataiku. His encouragement to our faculty at the 2017 NABE conference pushed us to forge ahead with our deeper curriculum changes into preparing economists for data science roles. Now if we can just get the administration to buy into our vision!

The test of time is how well these current students do in their careers, an answer we may have to wait years to know.

Importance of Economic Analysis to Data Science

I wrote this a few years ago (about 2014) and it still appears on my university department’s website. My thinking has evolved since then, but it is instructive where my thought was then.

Economists are unique in their approach to data analytics due to their unique training. They are story tellers, they are able to articulate problems and to take a rigorous approach to the solution of those problems. They understand the importance to understand the question: “why?”

Economists own causality and understand observational data, some are even said to be obsessed with the data generating process. Economists have a a strong linear regression toolkit and are well familiar with the processes that push beyond that level of rigor. Economists understand minimizing and maximizing of objective functions under constraint.

Read more:  Economists in Data Analytics

Blog Launch

Launching EconDataScience

Forty years ago I was sitting in a hotel room in New York City being interviewed for a tenured position at The University of Akron. At my on-campus interview I was given the challenge of rebuilding the graduate curriculum of Statistics and Econometrics. Revised in my image, they included an emphasis on Applied Econometrics, hands-on computing with real data sets and code level programming in SAS. 

Economists have always in my lifetime been sophisticated economic data analysts and I have taken note as the term and title of data science and data scientist has arisen that economists cover a vast amount of the territory of what is data science and in a way always have. 

One year ago, I organized for our Department and College, the first Data Science Day held at The University of Akron featuring two of our MA alumni that held the title of data scientist. A survey of our graduates found that all of our graduates alumni and about half of  our undergraduates were in data analytic positions and many in data scientist or data science positions. 

That economists make  good data scientists will be the subject of many posts of this blog.  I will also comment on issues of economic literacy which I regard as a crisis in our world.  I am less likely to comment on policy than on principles, the former being befuddled with all manner of things and the latter more inviolate, removed from opinion and evidenced based. 

Â