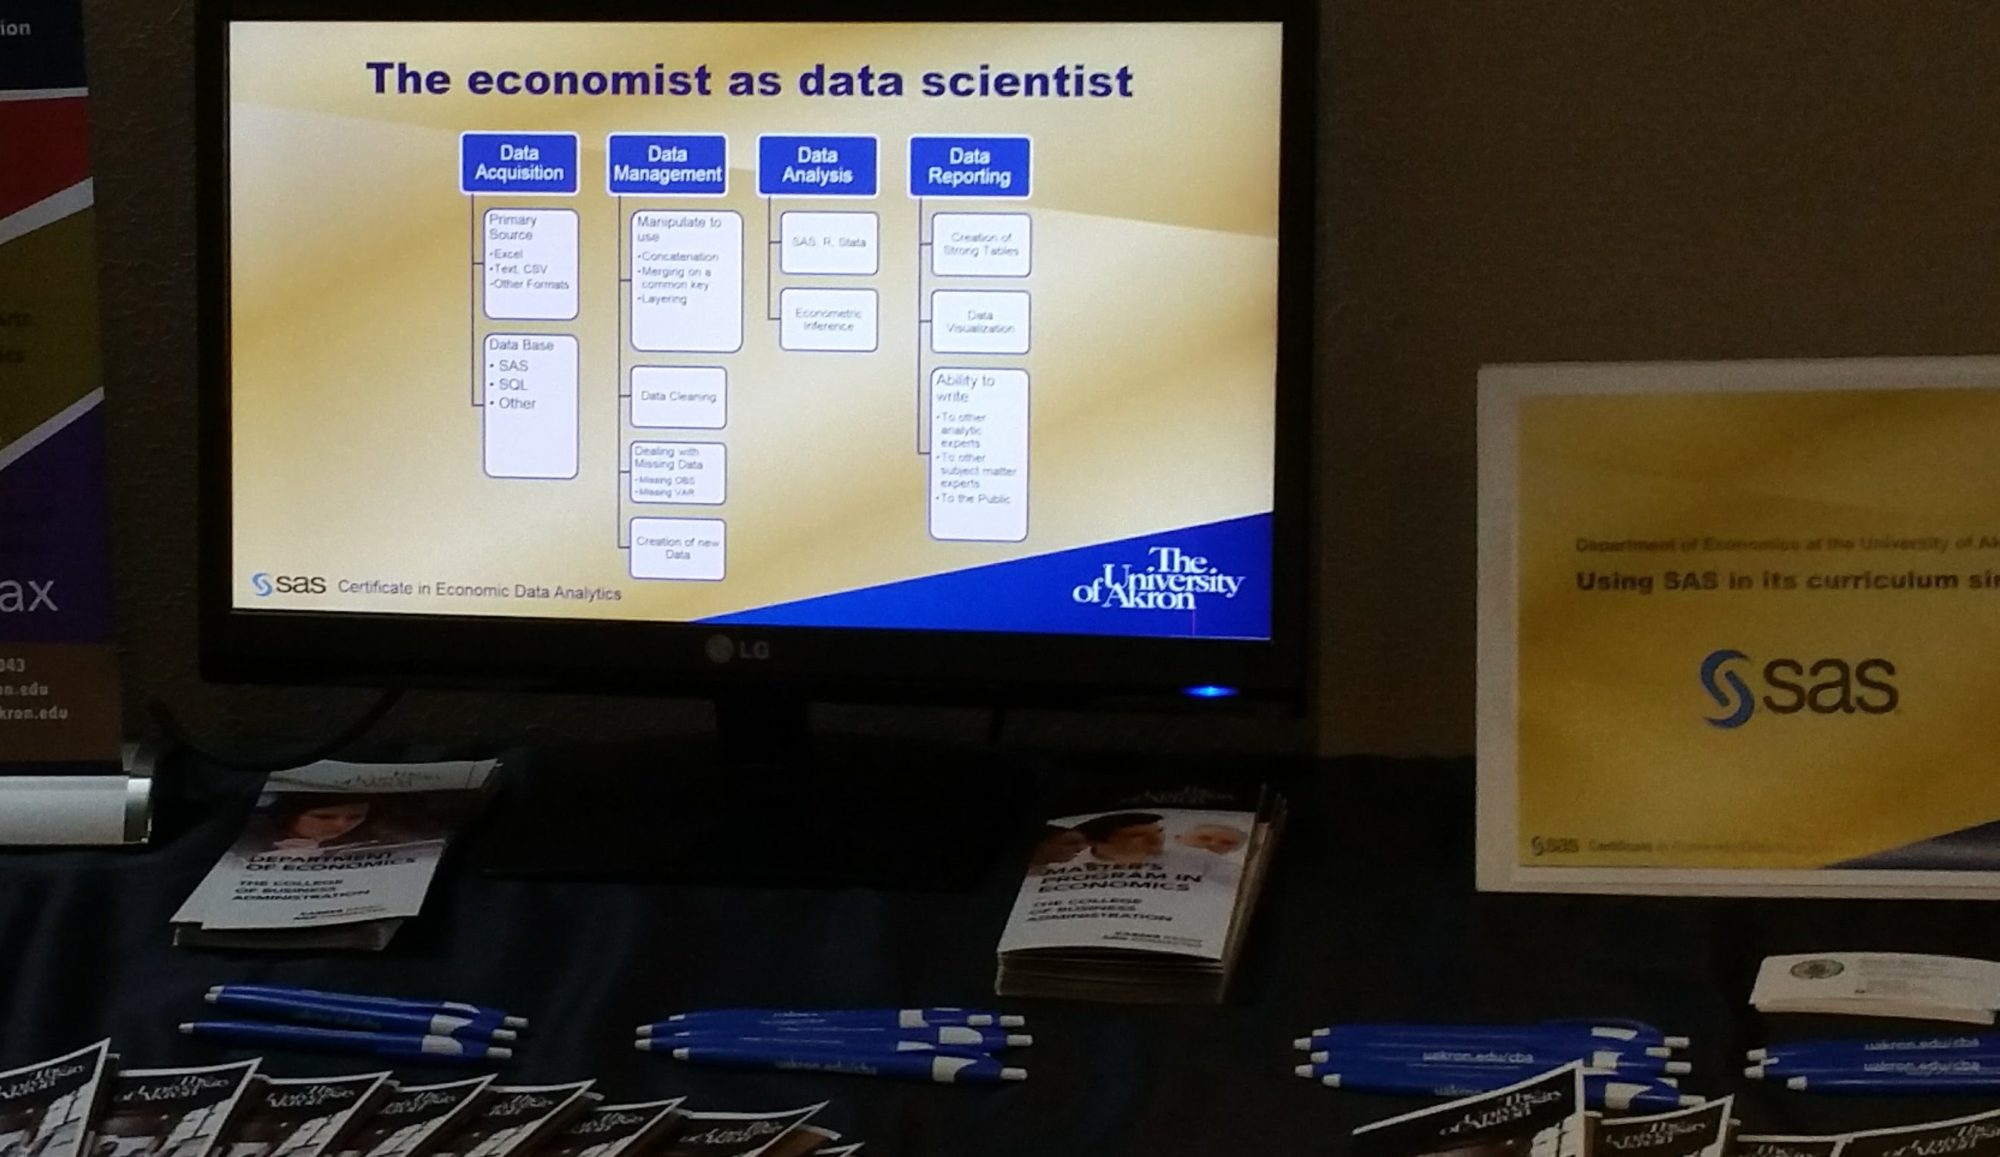
Economists, especially Econometricians, are in hot demand in the field of Data Science. Last March I posted Amazon’s Secret Weapon: Economic Data Sciences which was one of many similar articles on the high demand. It is the entire premise of this blog and my work at university is to highlight this and point economists and our business data analytic students in that direction. Our curriculum is centered on SAS because having the students learning to program at a base level and to learn the power of SAS is a good basis for future job employment (see Data Analytic Jobs in Ohio – May/June 2019).
Because we are looking for a couple of PhD economists for tenure track positions, I thought to wander around in JOE (Job Openings for Economists) and eventually wandered into wondering how many Data Science jobs were directly advertising in the JOE competing with academic positions (including ours).
So to sharpen my SAS SGPLOT skills i collected some data and found that indeed Data Scientists are in increasing demand over time in JOE , bur not as much as exists in the general market of Indeed.com. Clearly in JOE job listings in the August to December timeline are the best time to find a data science job, and August 2019 should grow as more jobs are added leading up to the ASSA meetings in San Diego in January. If you’re there look me up, but I suspect I will be in an interviewing room from dawn to dusk.
Enjoy! Comments welcomed.


For those wanting to see the SAS code
My apologies, Elementor does not handle txt code so well, or I have not yet figured that out. (Small amount of research shows the lack of a code widgit is a problem with Elementor.)
Code with data and image are available at https://github.com/campnmug/SGPLOT_Jobs
data ds;
input date MMDDYY10. total DStitle NotDStitle;
t=_n_;
Datalines;
2/1/2014 0 0 0
8/1/2014 2 2 0
2/1/2015 0 0 0
8/1/2015 5 2 3
2/1/2016 1 1 0
8/1/2016 11 5 6
2/1/2017 1 1 0
8/1/2017 12 6 6
2/1/2018 2 1 1
8/1/2018 14 11 3
2/1/2019 7 4 3
8/1/2019 12 6 6
;
run;
Title1 bold 'Data Scientist Jobs Are Increasing For Economists: Evidence from the AEA';
Title2 color=CX666666 'Advertisement for Data Scientists in Job Openings for Economists (JOE)';
title3 color=CX666666 "Counts shown are the result of a search of all listings for 'Data Scientist'";
proc sgplot;
vbar date / response = total discreteoffset=-.0 datalabel DATALABELATTRS=(Family=Arial Size=10 Weight=Bold)
legendlabel="Total Data Scientist Jobs" dataskin=gloss;
vbar date / response = DStitle transparency=.25 discreteoffset=+.0 datalabel DATALABELATTRS=(Family=Arial Size=10 Weight=Bold)
legendlabel="Job title is 'Data Scientist' " dataskin=gloss;
yaxis display = none ;
xaxis display = ( nolabel);
inset "To put this in perspective:" " "
"Most 'Data Scientist' and 'Economist' jobs"
"are not advertised in JOE"
"A search for 'Economist' and 'Data Scientist'"
"on Indeed.com yields 514 jobs on Oct 14, 2019"
/ position=topleft border
TEXTATTRS=(Color=maroon Family=Arial Size=8
Style=Italic Weight=Bold);
inset "Aug 2019" "preliminary"
/ position=topright noborder
TEXTATTRS=(Color=black Family=Arial Size=8
Style=Italic );

format date worddate12.;
footnote1 Justify=left 'JOE listings are at https://www.aeaweb.org/joe/listings';
footnote2 Justify=left 'Only active listings in either the Aug-Jan or Feb-Jul timeline were searched.';
footnote3 Justify=left 'Search conducted on Oct 14, 2019, so the last count will grow as new jobs are entered into the system.';
footnote4 ' ';
footnote5 Justify=left bold Italic color = CX666666 'Created by Steven C. Myers at EconDataScience.com' ;
run;
run cancel

