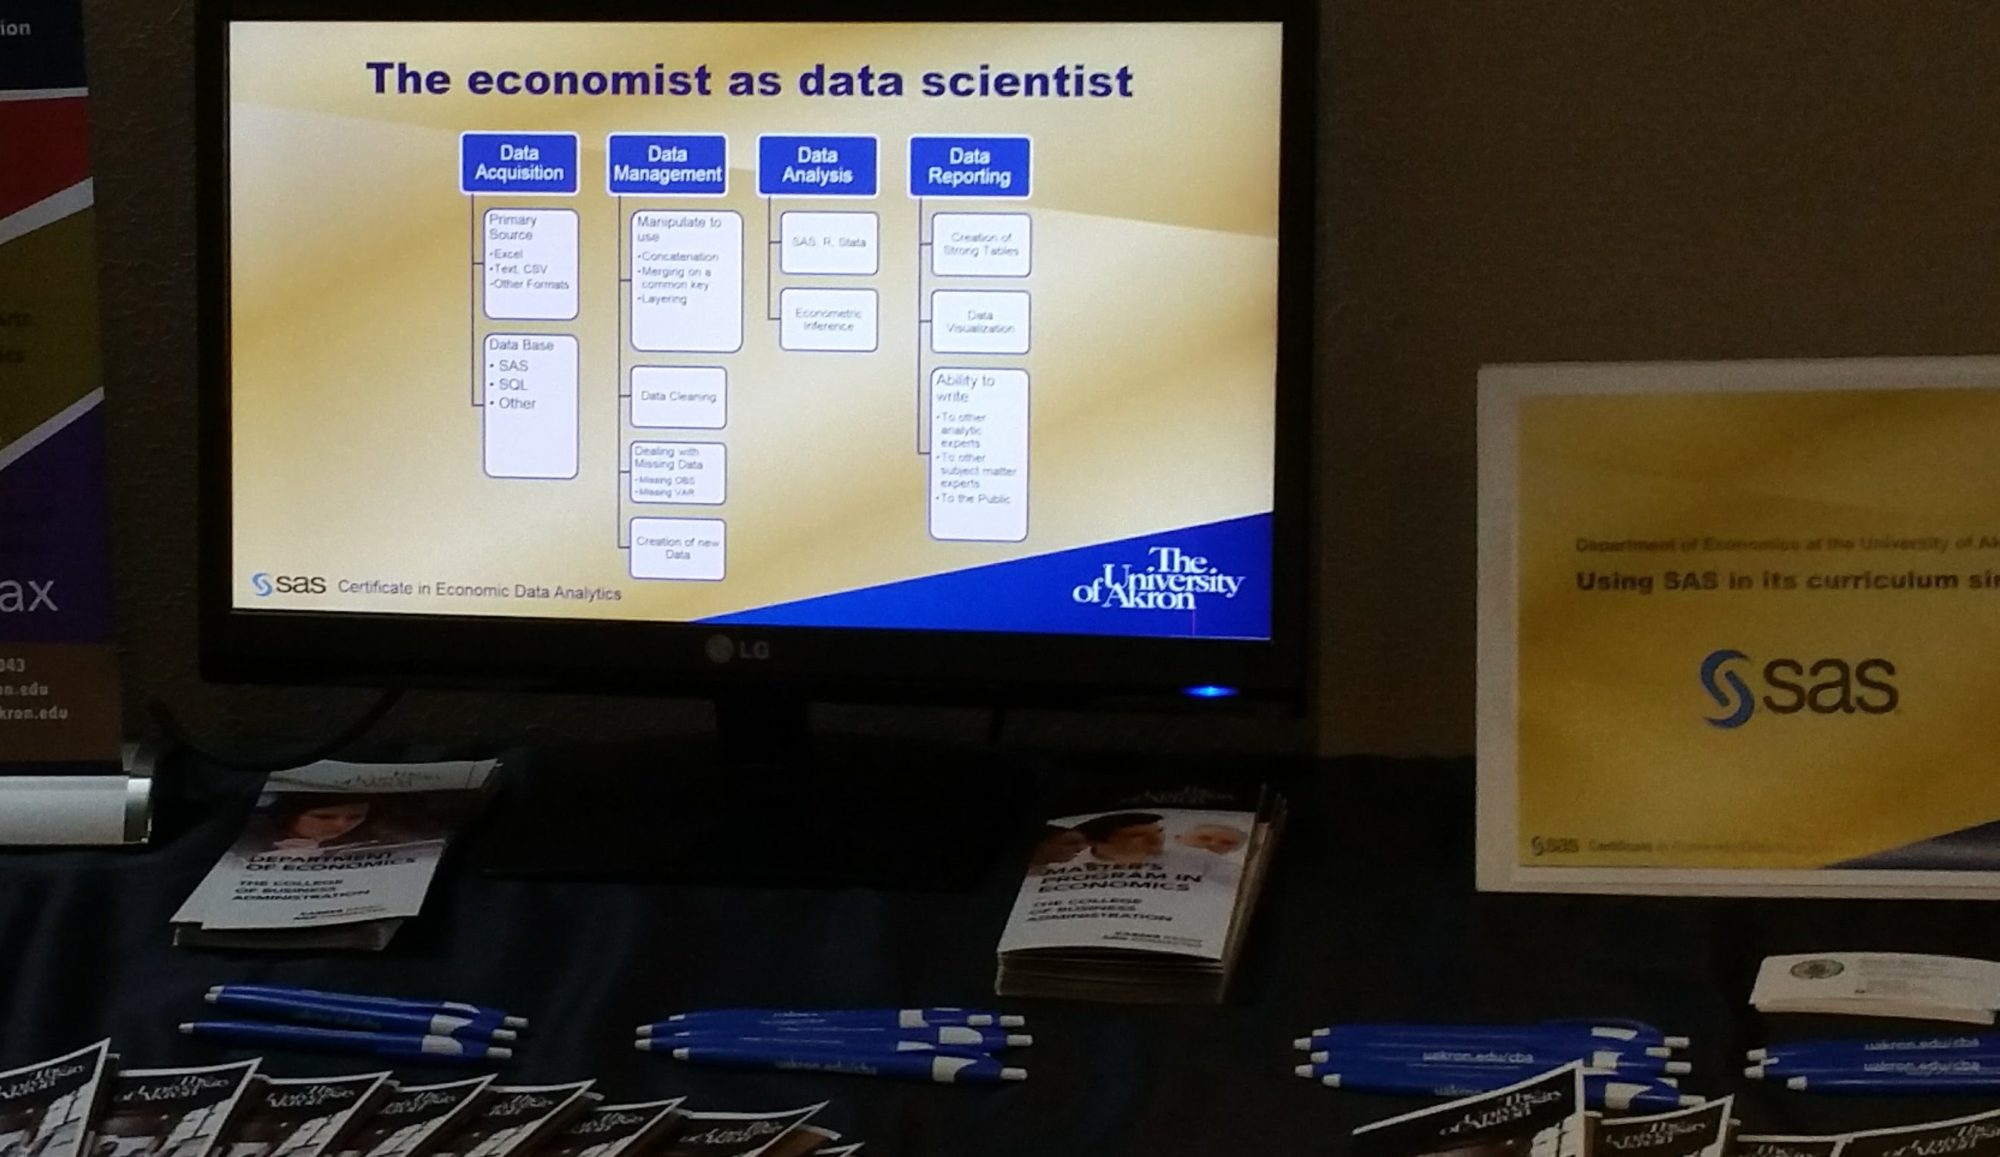
“Economists put the science in data science,” at least that is how the tag line goes on this blog. As we address our new Business Data Analytics degree in the College of Business Administration we need to know if our earlier plans for what is taught technically is still a good idea. Currently we teach SAS, R, and Tableau in Economics and students get SQL and JMP in other business courses.
Searches for jobs in Ohio and within 100 miles of Arkon Ohio were preformed by the author on Indeed.com to see how many jobs included certain key words. The geographical area “Ohio” is well known and bounded, the area “100 miles of Akron” includes jobe no only in NE Ohio, but includes jobs outside NE Ohio as this definition touches the circle of influence of the Columbus area and the Pittsburg area. There is no way to know whether all jobs in Columbus and Pittsburg are counted or only those to the NE and NW respectively of both cities.
Software Preference
SQL is the most mentionned software/language by far. After that R, Python, SAS and Tableau ranked in that order. Java and HTML are mostly used in web design and non analytic use. Salesforce was included because of the decision this week to acquire Tableau.
Two interesting points. (1) Excel was originally included and eliminated from Figure 1, because Excel was mentionned in 19,370 jobs in Ohio and 12,129 for jobs with 100 miles of Akron, OH. (2) SAS and SQL was examined with the result that 60% of SAS jobs in Ohio and 67% of SAS jobs within 100 miles of Akron also included mention of SQL.
SAS Presence
There are a good number of SAS mentions which is good for our students since we are a SAS program offering a SAS Certificate in Economic Data Analytics. As figure 2 shows, SAS is preferred by those employed by business, statistics and economics degree holders and figure 3 shows a preference for SAS in Fortune 500 companies.
Skill areas included
Searches were also done by key words, not just on software with the results shown in Figure 4. Shocking to economists is that “econometrics,” the study of applying data analysis to typically economi data has only 29 listings in Ohio. However, every econometric student knows regression and logit and statistical inference and prediction and forecasting and more, and we know most economics students go into data analytics with ease, so what to conclude. The term econometrics is foreign to the job opportunity listings and perhaps it is time for a more relevant and descriptive naming of what is taught in econometrics.
A typical economics student and especially one who gets our new Business Data Analytics can compete for most of the jobs including each of the keywords shown below making the new degree a very robust and rewarding one.

Wraping up
To complete the analysis of jobs, Figure 5 shows that jobs mentioning “management” is incredibly large. i speculate that this is because job descriptions include not only jobs for managers, but also word use such as “reporting to management” and “data management.”
Nevertheless, by including the names of departments in our college (except accounting), we get a sense of opportunities for various of our college majors, but a deeper search looking at sub fields such as supply chain, human resources, risk, insurance would have to be done, but the numbers are suggestive.
Just like Excel as discussed above, the word “data” is mentionned in nearly 20,000 jobs in Ohio and almost 13,000 within 100 miles of Akron. So many jobs now require data savy on the part of employees that any of the colleges degrees offered in teh college of buainess administration at the University of Akron (including accounting) leads to lots of openings advertising for their data skills.
And the bottom line
Our new economics degree, Business Data Analytics promisses to produce graduates in high demand.


